
Overview
The qudratic equation being demonstrated is
y = ax2 + bx + c
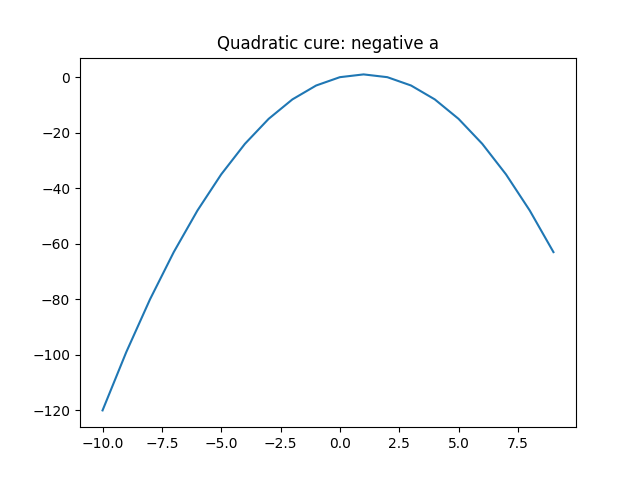
This was just a small python program which uses the matplotlib to demostrate the quadratic curves.
It was just to demonstrate the fact that it a ‘n’ parabolic curve for negative values of ‘a’ and a ‘u’ parabolic curve for postive values of ‘a’ regardless of ‘b’ and ‘c’ vaules
Code
# /// script
# dependencies = [
#   "matplotlib",
# ]
# ///
import array
import matplotlib
import matplotlib.pyplot as plt

def plot_quadcurve(a,b,c):
    xArray = array.array('i')
    yArray = array.array('i')
    for x in range(-10,10):
        xArray.append(x)
        y = a*x*x + b*x + c*x
        yArray.append(y)

    plt.plot(xArray, yArray)
    plt.show()


for c in range (-2, 3):
    for b in range (-2, 3):
        for a in range (-2, 3):
            print(f"a:{a},b:{b},c:{c}")
            plot_quadcurve(a,b,c)